|
|
Post by dubiousgolfer on Jul 8, 2020 18:23:27 GMT -5
Dr Mann Is what DT said anatomically correct? "It might still be passive torque, because the best golfers let their wrist go into flexion in this vicinity of the swing, which reduces the range of motion for wrist cock.
But I'm not at all sure of that."DG It is true that the wrist cannot radially deviate as much when the left wrist is bowed, but it can still ulnar deviate easily, so I cannot understand why he believes that left wrist bowing near P5.5 may affect the release of PA#2. Jeff. The way I interpreted DT's sentence , was that that the left wrist would have no option but to reduce radial deviation (ie. and release PA#2 angle ) to facilitate the increased flexion. Therefore its just an anatomically passive hand couple release of PA#2 angle. DG |
|
|
|
Post by dubiousgolfer on Jul 8, 2020 21:27:17 GMT -5
I was looking at Dr Kwon's graph for 'Touring Pros' again and wondering at what time before impact that green MOF line crosses the zero line. 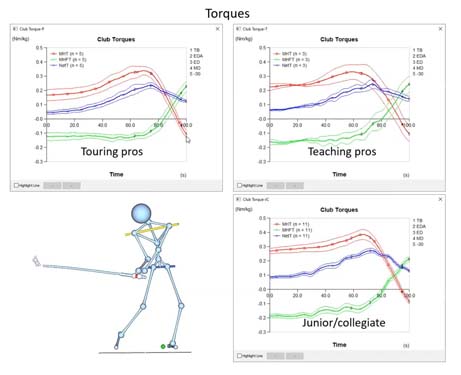 DG |
|
|
|
Post by imperfectgolfer on Jul 9, 2020 9:16:53 GMT -5
I was looking at Dr Kwon's graph for 'Touring Pros' again and wondering at what time before impact that green MOF line crosses the zero line. DG I don't know for sure because Dr. Kwon has not placed markers on the X axis, but I suspect that it is between P5.2 -P5.5. Jeff. |
|
|
|
Post by dubiousgolfer on Jul 9, 2020 11:00:38 GMT -5
Dr Mann You might be interested in this recently published paper (one can download it in .pdf ). www.mdpi.com/1424-8220/20/13/3672Sasho Mackenzie has posted the below image on his twitter acccount  DG Also some interesting tweets back and forth. Grant Lau@grantlau7c 7 Jul Replying to @sashomackenzie How accurate is measuring the forces and torques through the grip vs through inverse dynamics? Sasho MacKenzie@sashomackenzie 7 Jul This is still inverse dynamics. The sensors in the grip allow for individual hand forces to be computed. Grant Lau@grantlau7c 7 Jul It is? I thought inverse dynamics was recovering F&T based on the club's motion and knowledge of mass, MOI, etc... while this is measuring F&T based on resistance in a strain gauge. Sasho MacKenzie@sashomackenzie 7 Jul Yes. Consider the part of the club below the sensors in the grip. The sensors measure the forces the top part of the grip applies to the bottom. Cameras track the CoM of the bottom to get the accel. The bottom hand forces are determined knowing the sensor force and CoM accel. Grant Lau@grantlau7c 7 Jul Don't fully understand how the sensor measurements and CoM motion lead to R&L hand forces but I now see how it's inverse dynamics. Do you think having a set of force sensors covering the entire grip (as I initially thought was going on) would also work? Sasho MacKenzie@sashomackenzie 7 Jul Not really. That would give you grip pressure, which is interesting, but not that helpful in understanding the direct causes of club motion. Grant Lau@grantlau7c 7 Jul Even if it's a set of sensors which individually sit roughly flat as in this picture? I know a single sensor around the grip won't do anything. Probably also need something to orient the grip with respect to global coordinates.  Sasho MacKenzie@sashomackenzie 7 Jul That picture is what I was referring to. There have been an few studies published with those types of sensors. It would be very challenging to get a force predictive of club motion from such a device. Jon R Sinclair II@jrsii 7 Jul Replying to @sashomackenzie Not plausible! |
|
|
|
Post by dubiousgolfer on Jul 10, 2020 11:11:53 GMT -5
Some points that I noted in the article which I will add to in this post as I try and understand the article more fully.
"Direct measurement of internal grip forces revealed a threefold greater right-hand torque application compared to the left hand, and counterforce by both hands was also found. The joint force and torque of the left arm tended to precede that of the right arm, the majority of which had peaks around the impact and showed a larger magnitude than that of the left arm"
"All joints were modelled as ball joints"
"The rotational joint of the body was defined as the center of the end surface of the 3D frustum"
DG
|
|
|
|
Post by imperfectgolfer on Jul 10, 2020 17:58:54 GMT -5
DG,
I am incapable of understanding that Choi paper in any fruitful way.
Jeff.
|
|
|
|
Post by dubiousgolfer on Jul 10, 2020 19:58:45 GMT -5
Dr Mann
I've had great difficulty understanding this article because they are using coordinate systems fixed to the club sensor (that rotate with the club). Therefore the x,y,z axis are moving all over the place throughout the swing. Further, to conceptualise the individual left and right hand torque rotation planes , I have to use the 'Right Hand Rule ' in physics (which I won't go into detail again as its very confusing).
The only graphs worthwhile looking at are the ones that SMK highlighted in red in his twitter post (M) and (Q) which proves decisively that there is negative hand torque at impact (and basically disproves Nesbitt and Mike Jacobs/Manzella positive torque concept at impact).
Graphs M & N is showing:
1. A positive left hand torque that gradually increases in the downswing from P4-P5.5/P6 , then drops to negative torque by impact.
Graphs Q & R is showing:
2. A positive right hand torque that is slightly less than the left hand that is also slightly increasing from P4-P5.5 but then there is sudden peak 'blip' (twice as great as the left hand) probably triggering PA#2 release which then drops dramatically to a much bigger negative torque (3 times greater than the left hand) by impact.
3. It seems that approaching impact the right hand is 'impeding' the angular acceleration of the club 3 times more than the left hand.
Graph R is showing:
4. The right hand is applying a large 'pitching' type torque after PA#2 release that seems to max out by impact (ie. from a down the line view that would be a torque being applied in the clockwise direction. I suspect that this 'pitching torque' delivered via the right hand would be caused by the paddling/straightening right arm into impact.
Unless I am mistaken ,it does seem that torque actions delivered via the right hand is much greater than the left hand (look at the 'magnitude' graphs P and T). I'm assuming those graphs are the total torque activity delivered via each hand vs time (not specified in any particular direction- just a scalar value).
EXAMPLE:
For left hand, the P graph represents the 'modulus' values of graphs M + N + O (versus time)
For right hand, the T graph represents the 'modulus' values of graphs Q + R + S (versus time)
In fact they state the following in their 'Discussion ' section:
"To our knowledge, this is the first study that quantitatively demonstrates the dominant role of right-hand grip torque in club rotation, which was consistently observed among all
nine professional licensed golfers"
DG
PS. Although the right hand is dragging more than the left hand approaching impact , they have said that the right arm torque showed a rapid increase after mid-downswing with peaks around the moment of impact (I think that is graph 7N)
That suggests to me that the golfers are actively trying to keep their right hand moving with the increased angular velocity of the club , but still end up dragging behind approaching impact (ie. negative torque).
|
|
|
|
Post by imperfectgolfer on Jul 10, 2020 23:58:40 GMT -5
DG,
How does that sensor, which is small and seemingly placed between the two hands, measure forces/torques applied by the left and right hand?
|
|
|
|
Post by dubiousgolfer on Jul 11, 2020 6:43:17 GMT -5
DG, How does that sensor, which is small and seemingly placed between the two hands, measure forces/torques applied by the left and right hand? Dr Mann Good question because that sensor looks really small and held virtually in the mid-point between the hands. In the twitter chat SMK said they were still using inverse dynamics to calculate the torques and forces in each hand. Maybe this research article raises more questions than answers. DG PS. The article says the following: "To resolve the issue of closed-chain joint kinetics of the upper limb during golf swing, the force and torque between the two club segments held by each hand (referred to as the “internal grip force ” throughout the manuscript) were directly measured using a 6-axis force and torque sensor embedded at the customized grip. The measured internal grip force and the upper limb kinematic data were used to calculate the joint force and torque of the rest of the 9-linkage closed-chain system of upper limbs by 3D inverse dynamics analysis." I think the sensor picks up the forces and torques between the 2 interfaces of that sensor and each of the club segments above and below the sensor (where the hands are placed). Look at this You-Tube video where the the blue grip is attached to the top surface of that black sensor 'tablet' . A pressure force or twist on the grip can be converted to electrical signals and represented in graph form. The 'tablet ' in that golf handle seems to be a miniature version of one used on that robot but where both interfaces are being used to measure the grip 'force/torques' above and below the 2 interfaces. Below is a similar 6 axis Torque sensor where one can easily see how torques can be measured (look at 1:04 -1:17) So the technology looks impressive enough to conduct accurate measurements of the forces/torques applied by each hand. More basic information about 6 axis sensors can be found here but the one used in the golf club article was customised. blog.robotiq.com/bid/72841/6-Axis-Force-Torque-Sensor-What-Does-it-Means#:~:text=6%2Daxis%20stands%20for%20the,around%20those%20directions%20(axes). ADDENDUMAfter reading SMK's tweets, only the top grip segment/sensor interface is used to measure the left hand force and torque . They then measure the acceleration of the clubs COM to find the total torque required at the handle (ie. effect of both hands ) . But because they have the actual left hand force/torque sensor measurement they can deduce the right hand force/torque. So they are actually calculating the right hand force/torque using inverse dynamics. |
|
|
|
Post by dubiousgolfer on Jul 13, 2020 18:39:10 GMT -5
I was looking at Dr Kwon's graph for 'Touring Pros' again and wondering at what time before impact that green MOF line crosses the zero line. DG I don't know for sure because Dr. Kwon has not placed markers on the X axis, but I suspect that it is between P5.2 -P5.5. Jeff. Dr Mann I sent a copy of the above graphs to Dr Kwon and asked him the following: ------------------------ Dear Dr Kwon
May I ask at what time before impact did the green MOF line (in the below graph for 'Touring Pros' only) cross the zero Torque line axis?
It seems your graphs and avatars suggest that the lead wrist starts to uncock due to the 'hand couple' before MOF takes over.
I was wondering whether MOF crosses the zero line at the 70 msec mark before impact and whether it correlates with Jorgensen DP model findings. Where he found 'added positive torque' at exactly 70 msecs before impact provided a small amount of extra clubhead speed by impact .
------------------------ Dr Kwon has replied back to me below ----------------------- The green line crosses the zero line at about 70 ms before the impact on the average. On the average, uncocking starts slightly before EDA (lead arm parallel; Even #2 in the figure) so it is way ahead of the point where the green line becomes positive.
------------------------- So it seems that the uncocking of the lead wrist is due to the positive hand couple before EDA (P5) according to Dr Kwon's own swing position definitions below.  BA MB LBA LB EPR TB EDA ED MD BI MF LF But isn't it a coincidence that the 70 msec value turns up again as it did in the SMK video frame images? Imho , there might be some small 'passive' gradual uncocking of PA#2 from P4 due to the positive couple , but there could be some active 'kick start ' positive couple (mainly via the right hand if we believe Choi's graphs) to assist the MOF action to increase the clubs angular acceleration (and therefore its angular velocity) after it becomes positive 70 msecs before impact. If one used the strict TGM definition regarding the release of PA#2 , will this not mean that golfers are actually using a 'sweep release' pattern? That the uncocking might be very small and relatively passive from P4 to ED , then uncock significantly more (but still passively) due to increased lead wrist flexion from ED to MD just before the 'kick start' point? DG PS. I'm still unsure whether those golfers used for Dr Kwon's graphs can be assumed to be using optimal swing mechanics. I'm more inclined to believe no wrist uncocking until MOF induced release with passive wrists. |
|
|
|
Post by imperfectgolfer on Jul 14, 2020 16:38:31 GMT -5
DG, Thanks for posting videos on that sensor device. It is difficult for me to understand how that device can measure the forces/torques being applied by the lead hand, but if it is accurate then one still has to use inverse dynamics calculations to estimate the torques/forces being applied by the trail hand throughout the downswing. Does that research paper clearly define what forces/torques the trail hand is applying to the club handle between P4 => P5, P5 => P5.5, P5.5 => P6.5 and P6.5 => P7? If it does, then please explain it to me in simple prose language. I have always known that the club usually starts to release between P5 => P5.5, but I don't label that a sweep release. I generally ignore the first part of lead wrist uncocking when the amount is too small to definitively determine from 2D images and I define the "practical" onset of the release of PA#2 when it becomes more visually apparent,which is usually between P5.2 => P5.5, and I would label that a random release pattern. I reserve the term "sweep release" to the situation when the lead wrist uncocking phenomenon is readily apparent before P5. Dr. Kwon's claim that the release of PA#2 is happening before P5 is not visually apparent in any of the pro golfer swings that we have discussed. Virtually all the pro golfer swings we have discussed use a random PA#2 release action where it only becomes definitively apparent in swing videos somewhere between P5.2 => P5.5 and where there is a simultaneous straightening action of the trail elbow that is also visually apparent.
You also wrote-: "but there could be some active 'kick start ' positive couple (mainly via the right hand if we believe Choi's graphs) to assist the MOF action to increase the clubs angular acceleration (and therefore its angular velocity) after it becomes positive 70 msecs before impact."
However, the club does not increase its angular acceleration after P5.5. Those kinematic graphs I posted show that the slope of the clubhead speed graph does not steepen after P5.5.
Jeff.
|
|
|
|
Post by dubiousgolfer on Jul 14, 2020 17:56:22 GMT -5
Dr Mann
Those Choi graphs are not really detailed enough to make an accurate analysis of the torques and forces during the downswing. One would have to make assumptions about how 'on average' the golf club was orientated in space from P4 -P7 , and then try and identify where the x, y axis were pointing, then cross reference with the graphs. Except the graphs only show the avatars at P4 and P7, so difficult to identify the forces/torques at P5, P5.5, P6, P6.5 .
On reflection, I think your correct about those graphs showing no 'visible' increase in the clubs acceleration after 70 msec point before impact. Even with a 'hand couple' of approx 13 Nm at that 70 msecs point (ie. see SMK's multiple major winner 'In Plane Couple graph' images in previous posts), there wouldn't be enough time to increase the angular momentum (ie. angular velocity of club if the MOI of club is assumed constant) by any significant amount in the 20 msecs (approx) it takes to drop to zero (probably an increase of less than 2 mph).
DG
The below is for my own future reference
Angular Momentum (L) = MOI (I) x angular velocity(w)
L= Iw
Assume MOI of club is constant therefore a change in angular momentum dL would mean
dL = I (dw)
but v=rw (ie. velocity =radius/angular velocity)
w= v/r
dw= dv/r
Therefore :
dL = I(dv)/r
I is approx = mr2
dL = mr2(dv)/r
dL= mr(dv)
dv= dL/mr = change in clubhead velocity
m = mass of club = 400 gms approx = 0.4 kg
r= radius of club = 43 inches = 1 metre approx
dv = dL/0.4
But change in angular momentum (dL) = angular impulse = Torque (13 Nm) x time (0.02 secs) = 13 x 0.02 = 0.26
dv = 0.26/0.4 = 0.65 m/s = 1.45 mph
Therefore change in clubhead velocity due to a constant 13 Nm torque applied for 20 msecs = 1.45 mph
If you look at SMK 'In Plane Couple Graph' the residual hand couple torque after 70 msecs from impact reduces rapidly from 13 Nm to zero in those 20 msecs , therefore the average Torque is probably a lot less than 13 Nm (maybe even 50% ) . Therefore any realistic increase in clubhead velocity due to Hand Couple only is probably less than 1 mph.
|
|
|
|
Post by dubiousgolfer on Jul 15, 2020 21:42:22 GMT -5
Not sure whether this will be helpful but I've enlarged the Choi graphs and added the 'moving coordinate' system to show the direction of the +/- x and y axis .The red dot signifies an axis (which I've labelled) that is pointing generally outwards of the page. Lets look at the force graphs for left and right hand in the downswing phase between P4 -Release (ie. I'm guessing 'Release' is near the peak crest) ![]()  Graphs A shows 1.That the left hand has an overall pulling force component in the +x direction axis Graph E shows 2.That the right hand has an overall pushing force component in the -x direction axis. Now we will look at the left and right hand torque graphs for the downswing phase from P4- Release (near the peak crest)  Graph N shows: 1. Positive torque via left hand in the general anticlockwise direction Graph R (ie. under graph N) shows: 2. Positive torque via right hand in the general anticlockwise direction. Both hands are applying positive torque but the overall forces applied by each hand across the shaft are opposing each other. DG |
|
|
|
Post by dubiousgolfer on Jul 16, 2020 8:18:46 GMT -5
The other things I've noticed in those Choi graphs 'O' and 'S' is that the left and right hand torques along the shaft 'z' axis look very small for PA#3 release . The left and right hand torques are virtually zero but where the right hand torque (graph 'S') shows a very slight peak then drops to zero before impact. It then actually goes very slightly negative after impact for a short period before going back to zero. DG PS. Be interesting to compare the Choi graphs to SMK's model graphs below (comparing the M_Wrist and and M_Arm). To denote the muscular torque at the joint, the Q_ is changed to M_ (e.g., M_Shoulder).   |
|
|
|
Post by imperfectgolfer on Jul 16, 2020 9:31:04 GMT -5
DG,
I have learned nothing new from that research paper - based on your comments.
I presently think that best biomechanical explanation of the cause of the start of the release of PA#2 is a right arm straightening action that happens after the right upper arm gets fully adducted against the right side of the mod-torso by P5.2- P5.5.
Jeff.
|
|
